Consumer theory
To answer questions about individual decision making, we need a model of individual behavior. Our model of consumer behavior is based on the following premises:
- Individual tastes or preferences determine the amount of pleasure people derive from the goods and services they consume.
- Consumers face constraints or limits on their choices.
- Consumers maximize their well-being or pleasure from consumption, subject to the constraints they face.
Sturcture of consumer theory
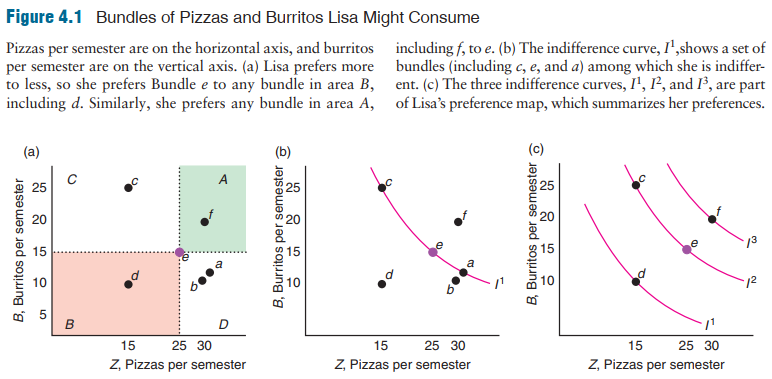
- Preferences. We use three properties of preferences to predict which combinations, or bundle, of goods an individual prefers to other combinations.
- Utility. Economists summarize a consumer's preferences using a utility function, which assigns a numerical value to each possible bundle of goods, reflecting the consumer's relative ranking of these bundles.
- Budget Constraint. Prices, income, and government restrictions limit a consumer's ability to make purchases by determining the rate at which a consumer can trade one good for another.
- Constrained Consumer Choice. Consumers maximize their pleasure from consuming various possible bundles of goods given their income, which limits the amount of goods they can purchase.
- Behavioral Economics. Experiments indicate that people sometimes deviate from rational, maximizing behavior.
Properties of Consumer Preferences
- Completeness
- Transitivity
- More Is Better
Indiffernce curves
Proposition:
- Higher is better
- Downward sloping
- Never cross
- One indifference curve through any given bundle
Utility Functions
Let's move from verbal representation of preference assumptions to mathematical representation. We assume that any persons preferences generated by some mathematical function. For example your preferences for place of work is generated by $U(job market, nature) = \sqrt{JobMarket*Nature}$$ formula.
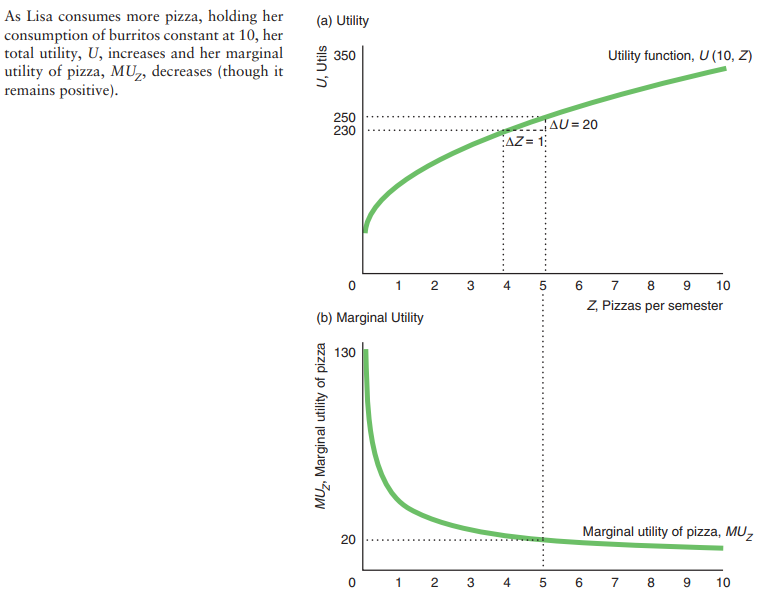
If we knew the utility function—the relationship between utility measures and every possible bundle of goods—we could summarize the information in indifference maps succinctly. Lisa's utility function, U(Z, B), tells us how many utils she gets from Z pizzas and B burritos. Given that her utility function reflects her preferences, if Lisa prefers Bundle 1, (Z1, B1), to Bundle 2, (Z2, B2), then the utils she gets from the first bundle are greater that from the second bundle: U(Z1, B1) 7 U(Z2, B2). For example, suppose that the utility, U, that Lisa gets from burritos and pizzas is \(U(Z,B) = \sqrt{Z*B}\). From Equation, we know that the more she consumes of either good, the greater the utility that Lisa receives. Using this function, we can determine whether she would be happier if she had Bundle x, with 16 pizzas and 9 burritos, or Bundle y, with 13 of each. The utility she gets from x is 12 (= 216 * 9) utils. The utility she gets from y is 13 (= 213 * 13) utils. Therefore, she prefers y to x. The utility function is a concept that economists use to help them think about consumer behavior; utility functions do not exist in any fundamental sense.
Marginal Utillity
Slope and shape of indifference curves
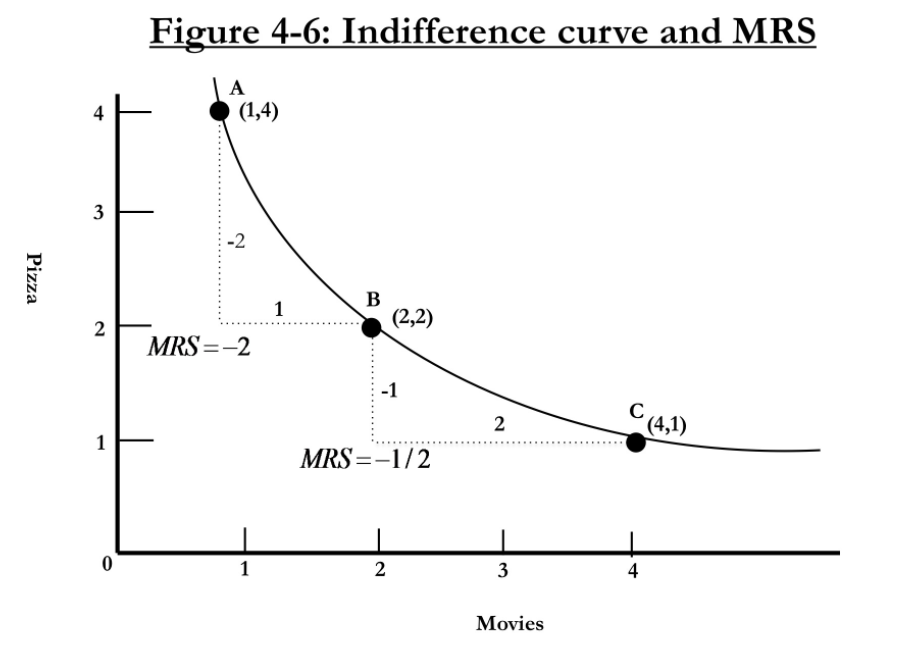
The slope of indifference curve is the rate at which you're willing to give up one good to get another.
Graphs are taken from Jonathan Gruber Microeconomics course
**MRS = \frac{- \Delta P }{\Delat M} = \frac{-MU_{movies}}{MU{pizzas}}
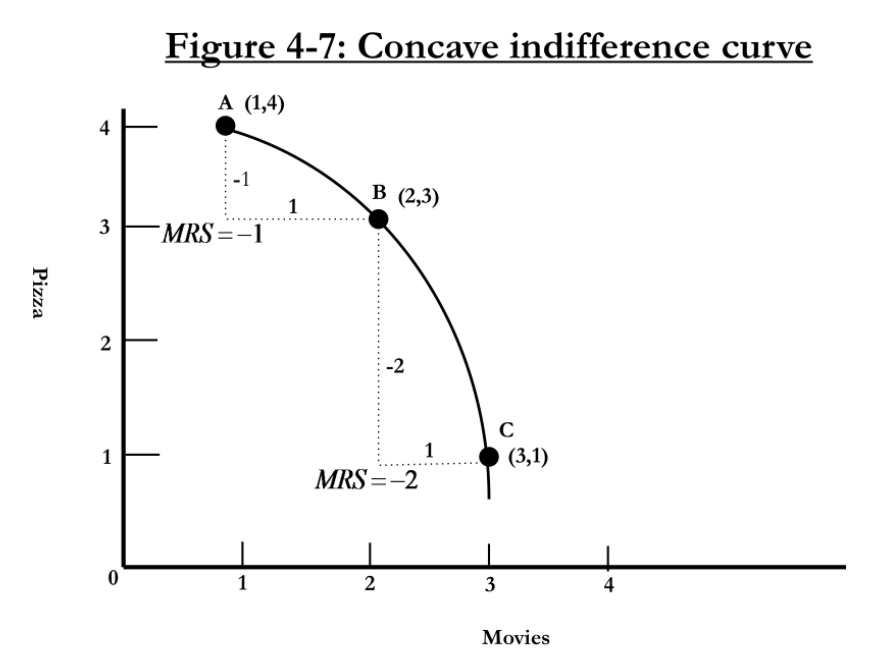
The marginal rate of substitution is diminishing. And that's because of the diminishing marginal utility. Marginal utility diminishes, because each additional movie is worth less to you that the one before. Each additional pizza is worth less to you than the one before.
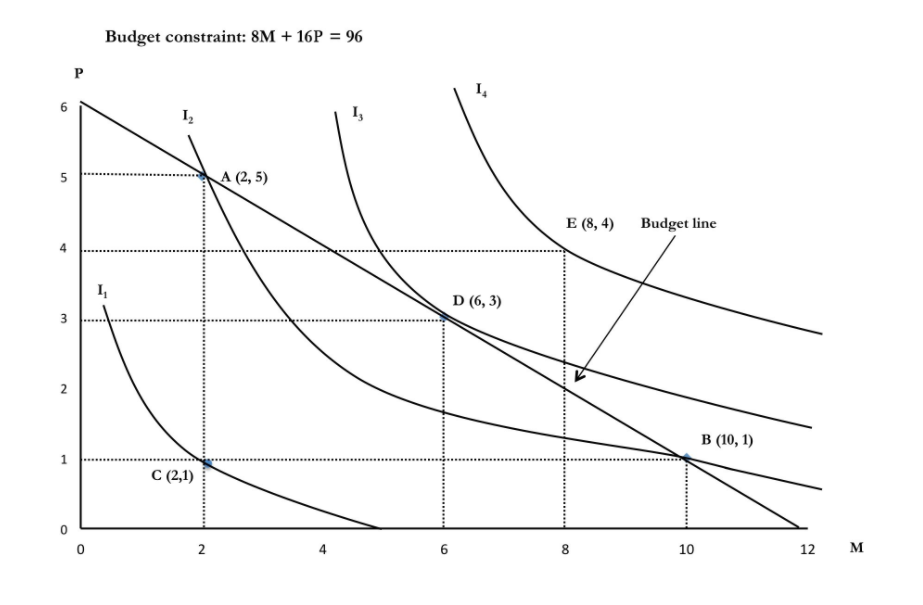
Budget constraint
Knowing an individual's preferences is only the first step in analyzing that person's consumption behavior. Consumers maximize their well-being subject to constraints. The most important constraint most of us face in deciding what to consume is our personal budget constraint.
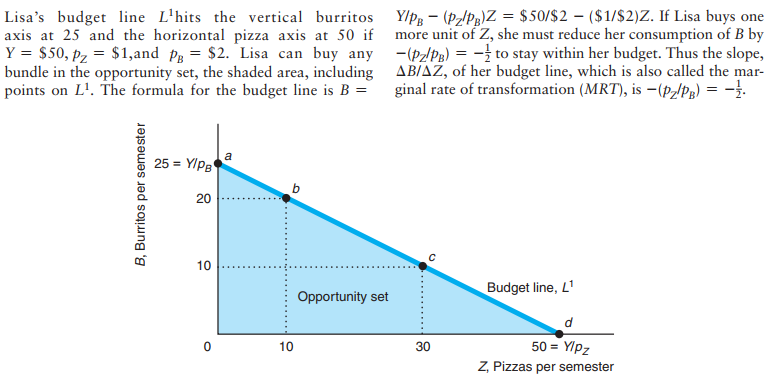
The slope of the budget line is called the marginal rate of transformation (MRT): the trade-off the market imposes on the consumer in terms of the amount of one good the consumer must give up to purchase more of the other good:
\[MRT = \frac{-P_z}{P_B}\]Marginal rateof substitution is the rate at which you desired to trade off pizza for movies staying indifferent. The marginal rate of transformation is the rate at which the market allows youto trade off pizza for movies.
Marginal rate of substitution is about your tastes. It's about the rate at which you desire to trade one off for the other. The marginal rate of transformation is about the market conditions. It's the rate at which the market allows you to trade off one for the other.
Opprotunity cost is the value of the next best forgone alternative.
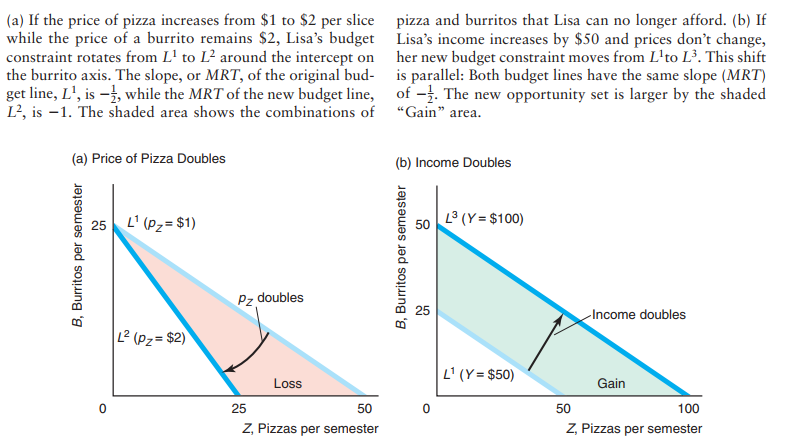
Changes to budget constaraints
Constrained Choice
When we choose a point, we are thinking od marginal decisions. Whether we should have next pizza, or should we have next movie?
\(MRS =\frac{-MU_{A}}{MU_{B}}\), is the amount of A that will be given up for obtaining each additional unit of B.
At the optimum bundle(point) the marginal rate of substitution equal to the marginal rate of transformation. In other words the rate at which you'd like to trade off pizza for movies should be equal to the rate at which the market is allowing you to trade off pizza for movies.
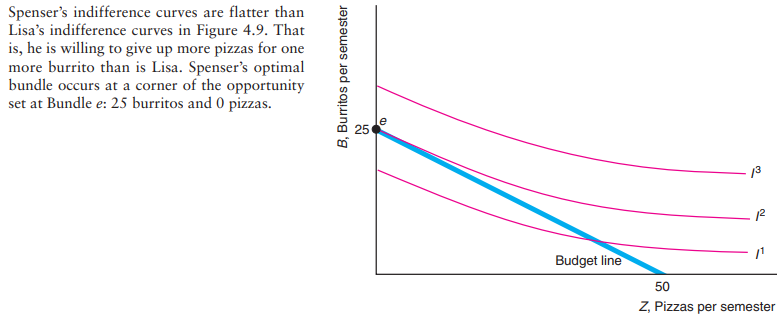
Corner solution
We end up with optimal bundle that is combination of two goods, but in some cases a consumer will end up just with one good.
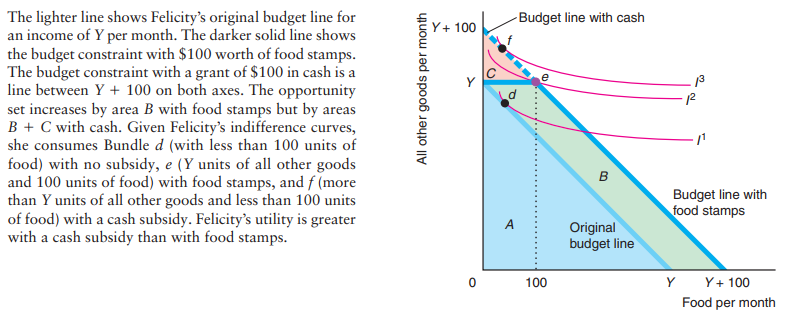
Food stamps
Exercise
Nate's utility function over jelly, J, and peanut butter, N, is U = JN. Nate's marginal utility from jelly is MUJ = N, and his marginal utility from peanut butter is MU N = J.15 The price of a jar of jelly is $5. The price of a jar of peanut butter is $10. Nate has a budget of $100 to allocate to these two items. If Nate maximizes his utility, how much of each good does he consume? Answer
- Derive Nate's budget line by setting his expenditure equal to his budget. The expenditure on each item is its price times the amount consumed, so Nate's budget, 100, equals the sum of the expenditures on these two goods: 100 = 5J + 10N.
- Use Equation 4.8 to find the relationship between N and J. Equation 4.8 states that Nate maximizes his utility if he equalizes his marginal utility per dollar across jelly and peanut butter: MUJ/5 = MUN/10. That is, N/5 = J/10 or N = J/2.
- Substitute this utility-maximizing condition into the budget equation to determine J and N. Substituting this optimality condition into the budget constraint, we learn that 100 = 5J + 10N = 5J + 10(J/2) = 10J. Solving this expression for J, we find that J = 10.
- Substitute the solution for J into the budget line to solve for N. Substituting J = 10 into the budget constraint, we learn that 100 = 5J + 10N = 50 + 10N, or 50 = 10N, or N = 5. Thus, Nate's utility-maximizing bundle is ten jars of jelly, J = 10, and five jars of peanut butter, N = 5
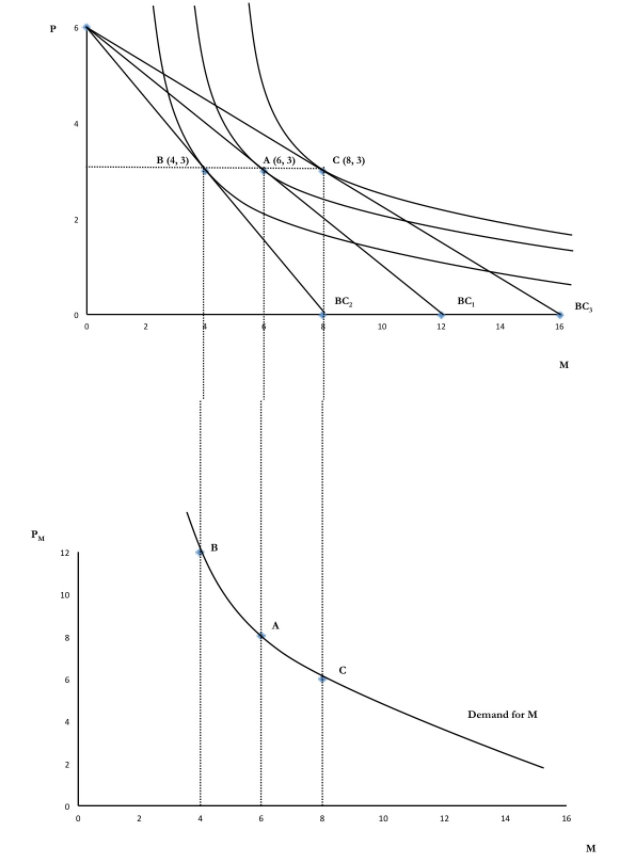
Demand Curve
Deriving Demand Curve
Shock of Income to Demand Curve
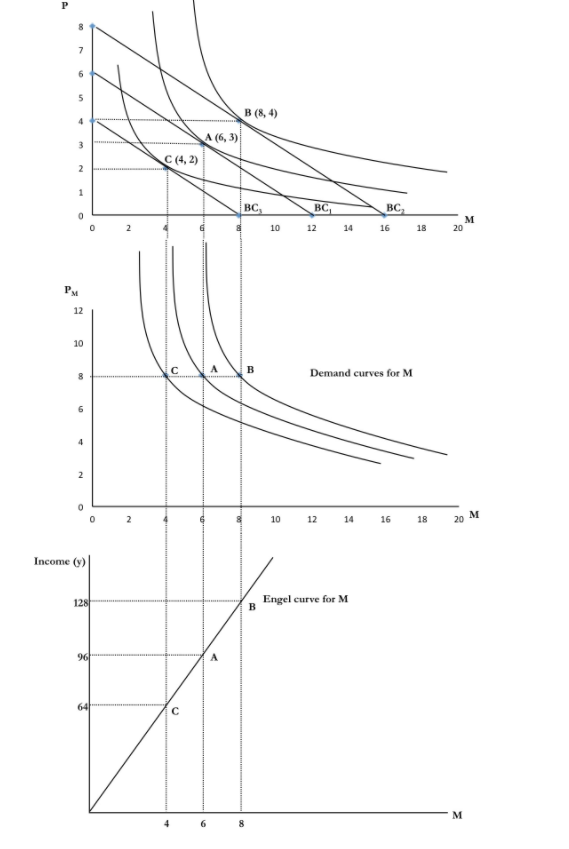
Income elasticity of Dmenad \(\xi= \frac{\Delta Q/ Q}{\Delta Y/ Y}\)
Most goods, like cars and food, have positive income elasticities. A good is called a normal good if as much or more of it is demanded as income rises. Thus, a good is a normal good if its income elasticity is greater than or equal to zero: \(\xi \geq 0\).
Some goods, however, have negative income elasticities: \(\xi < 0\). A good is called an inferior good if less of it is demanded as income rises. We are not making a value judgment when we say a good is inferior. An inferior good need not be defective or of low quality. Some of the better-known examples of inferior goods are foods such as potatoes and cassava that very poor people typically eat in large quantities. Some economists—apparently seriously—claim that human meat is an inferior good: Only when the price of other foods is very high and people are starving will they turn to cannibalism. Bezmen and Depken (2006) estimate that pirated goods are inferior: a 1% increase in per-capita income leads to a 0.25% reduction in piracy.\
Another strange example concerns treating children as a consumption good. Even though people can't buy children in a market, people can decide how many children to have. Guinnane (2011) surveyed the literature and reported that most studies find that the income elasticity for the number of children in a family is negative but close to zero. Thus, the number of children demanded is not very sensitive to income.
Luxuries are the goods that have \(\xi >1\) and necessities are the goods that have \(\xi < 1\).
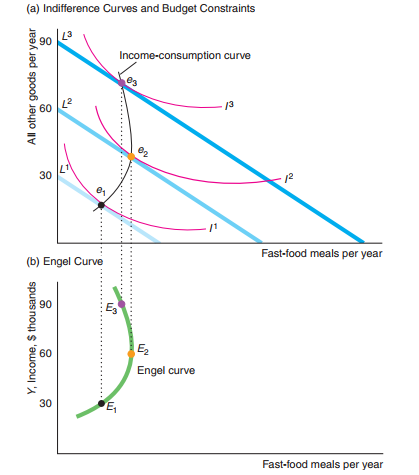
Fast food engel curve
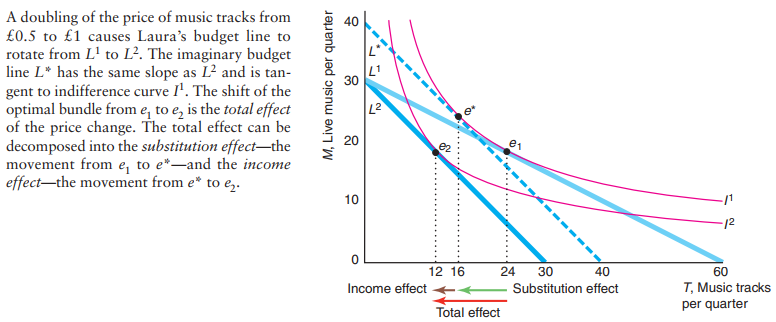
Income effects and Substitution effects
When the price goes up the demand for good goes down. It is happening from two differnt effects, namely income effect and substitution effect.
The substitution effect is, when a price goes up, how much less of that good do you want, holding your utility constant.
The income effect is, how much less of the good do you want because you are having less money.
Inferior good
If a good is inferior, the income effect and the substitution effect move in opposite directions. For most inferior goods, the income effect is smaller than the substitution effect. As a result, the total effect moves in the same direction as the substitution effect, but the total effect is smaller. However, if the income effect more than offsets the substitution effect, we have a Giffen good, for which a decrease in its price causes the quantity demanded to fall. \
Jensen and Miller (2008) showed that rice is a Giffen good in Hunan, China. Ximing, a typical inhabitant of Hunan, views rice as a Giffen good. A fall in the rice price saves him money that he spends on other goods. Indeed, he decides to increase his spending on other goods even further by buying less rice. Thus, his demand curve for this Giffen good has an upward slope. \
However, the Law of Demand (Chapter 2) says that demand curves slope downward. You're no doubt wondering how I'm going to worm my way out of this apparent contradiction. The answer is that I said that we believe in the Law of Demand because we do not observe upward sloping demand curves, not because our theory says that it must be true. It is theoretically possible for a demand curve to slope upward, but other than rice consumption in Hunan, China, economists have found few real-world examples of Giffen goods.
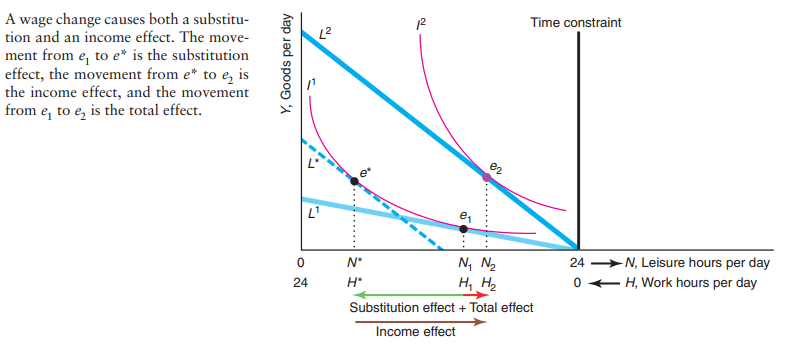
Labor Supply
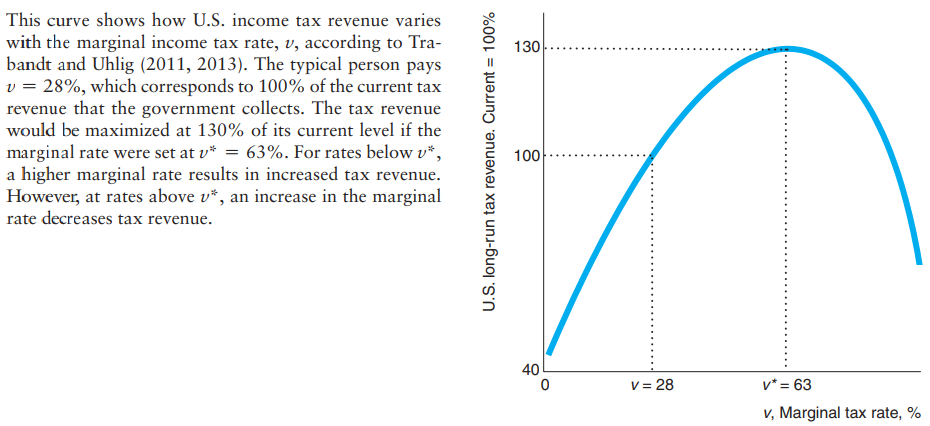
Tax rate
Child Labor