How regression is used to find answers for questions
Assume that we are researching question how the age of the person affects his wages. To answer this question first we need data that have variation in the ages of people, and we want to sat that with the change of age, does that make difference in wages.
\[wages = ages + error\_term\]Basically every empirical paper needs to have three things.
- Outcome variable (Left-hand-side).
- Independent variable (Right-hand-side, explanatory variable)
- Variation in the independent variable. (Variation in the independent variable should be “good”, unrelated to changes in outcome variable)
Hit or Miss? The Effect of Assassinations on Institutions and War.
Idea is we are not going to look at all leadership changes, but we look at very small set of changes, where assassin tried to take a shot at the president. We will treat as "good"(quasi-random) variation as if it was a randomized experiment. However decision to assasinate president is for sure not random. What random here is the outcome of assasination, whether attack was sucessfull or not. For example, idea that want to compare Reagan assasination and Kennedy assasination, or in other words whether the bullet actually successfully killed the president or not is close to random as possible.
To see whether changing the leader matters, we look at assassination attempt \(i\) and estimate the following regression: \(y_i = \beta SUCCESS_i + \epsilon_i\)
- \(y_i\) is:the outcome variable (e.g., change in democracy levels from year before assassination attempt to 5 years after attempt)
- \(SUCCESS_i\) is: a dummy variable: = 1 if leader killed and = 0 if survives
- \(\epsilon_i\) is: an error term (Noise)
- \(\beta\) is: the average impact of a successful assassination on y
You can have in mind, picture wherey is just one column in your spreadsheet, that is your outcome variable. X’s is the columns that is your data. \(\epsilon\) is the missing data in your spreadsheet, that describes real formula in the world for the phenomena that you researching by. \(\beta\) is the coefficient that we are searching for.
In this simple regression \(\hat{\beta}\) is just the difference in \(y_i\) between when the attempt succeeds and when it fails, i.e. \(\hat{\beta} = E[y | SUCCESS = 1] − E [y | SUCCESS = 0]\)
\(\hat{}\) symbol usually represent estimate of parameter.
The key assumption that author make in this paper that explanatory variable in this case success and the noise(\(\epsilon\)) are uncorrelated.
Exogenous variation means that the x’es and the \(\epsilon\) are uncorrelated.
Why we need "good" variation assumption here(a.k.a exogenous)?
Suppose we calculated \(\hat{\beta} = E[y|SUCCESS = 1] − E[y|SUCCESS = 0]\) Substituting in that \(y_i = \beta SUCCESS_i + \epsilon_i\) yields \(\hat{\beta} = \beta + E[\epsilon | SUCCESS = 1] − E [\epsilon | SUCCESS = 0]\) Thus we required that \(E [\epsilon | SUCCESS = 1] = E [\epsilon | SUCCESS = 0]\), i.e. that \(\epsilon\) is uncorrelated with SUCCESS, what it means that there is no systematic relationship between success and the realization of the error term \(\epsilon\). Then \(\hat{\beta} = \beta\). That is why in order to get the estimate of the true beta we are requaried for error term to be uncorrelated with explanatory variable.
\(y\) captures the outocome for the contry to become a democract between the year before the assasination attempt and the year after the assasination attempt.
You can never check whether your error term is uncorrelated with your explanatory variable. This an assumption that you should make.
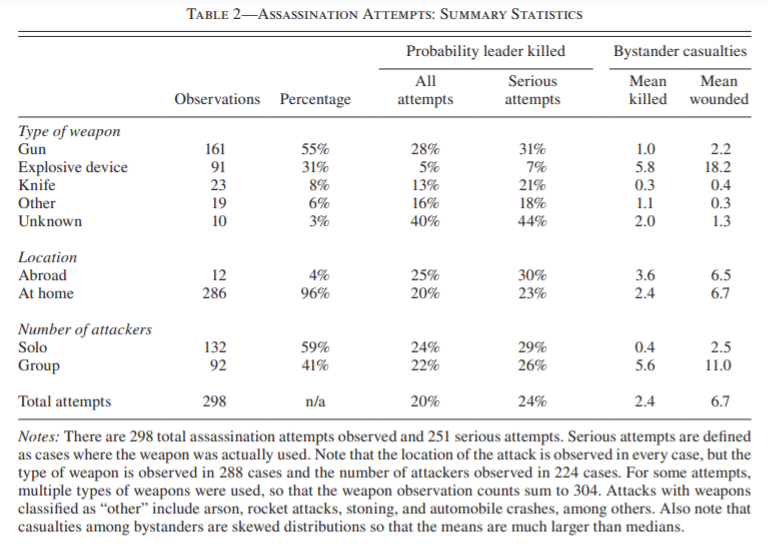 From table 2 we can see that assasination attempts using guns were more successfull, than using bombs.
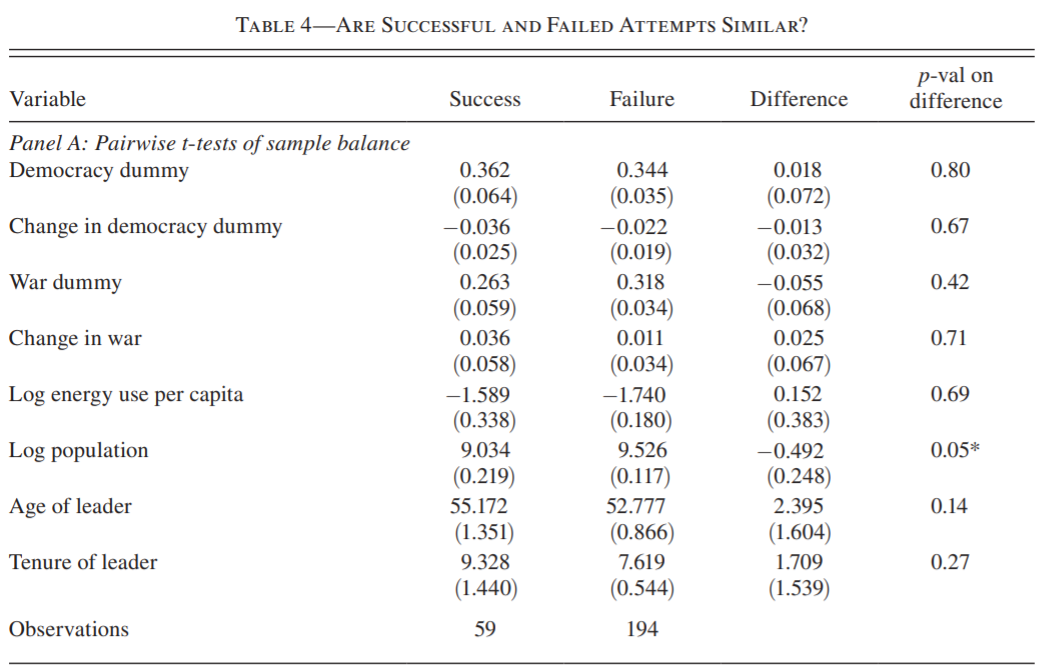 In table 4 authors looks at different variables and look whether they are corellated with success or not. Table 4 shows that countries that have successfull assasination attempt and countries that have failed assasination attempt are dont differ systematically on average. Still the statement that, error term and probability of SUCCESS is uncorrelated, is an assumption. But you'd say that if they were correlated, then the two groups would have differnt outcomes.
We can cotrol in this regression for factor that might create correlation between explanatory variable and error term. Now we want to make assumption whether error term and SUCCESS is uncorrelated conditional what type of weapon you use. We control for factors that we can observe in the data, since including this factors, will take out that correlation between explanatory variable and the residual.
The paper restrics data to "serious assasination attempts", where the gun was fired, bomb exploded, etc.
Regression formula: \(y_i = \beta SUCCESS_i + \gamma WEAPON_i + \epsilon_i\), where WEAPON is the dummy variable, from what type of weapon assasination was conducted.
When you include dummy variables in the regression you actually run regression for each category in your dummy variable. For example in the above case, you would run one regression, when the gun was fired, another one when bomb detonated and etc. In the end you find coefficients for each regression and then you simply take weighted average of this coefficients.
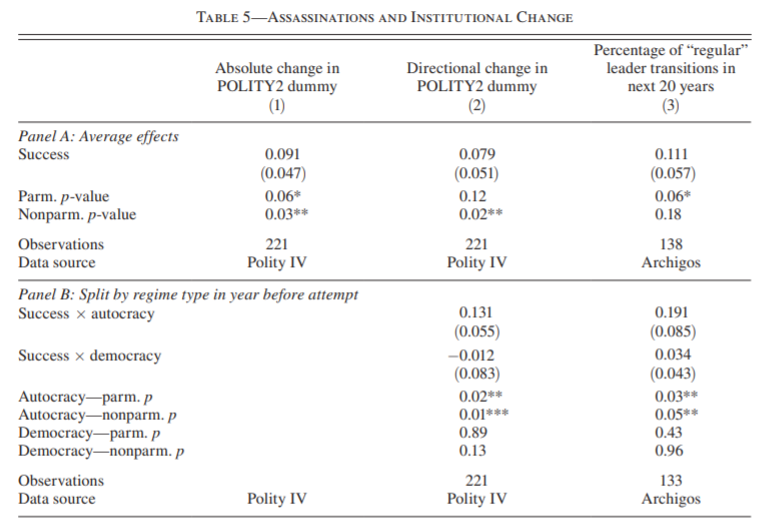 From table 5 we can see that if assasination was successful, then there is 9 percantage point more likely to have a change in outcome. Panel B allows us to look separately at successful assasination when you were in an autocracy to begin with and when you were a democracy to begin with. Panel B shows that the country much more likely to beome a democracy if you had a successful assasination attempt in an autocracy, but no change if you are already democratic.
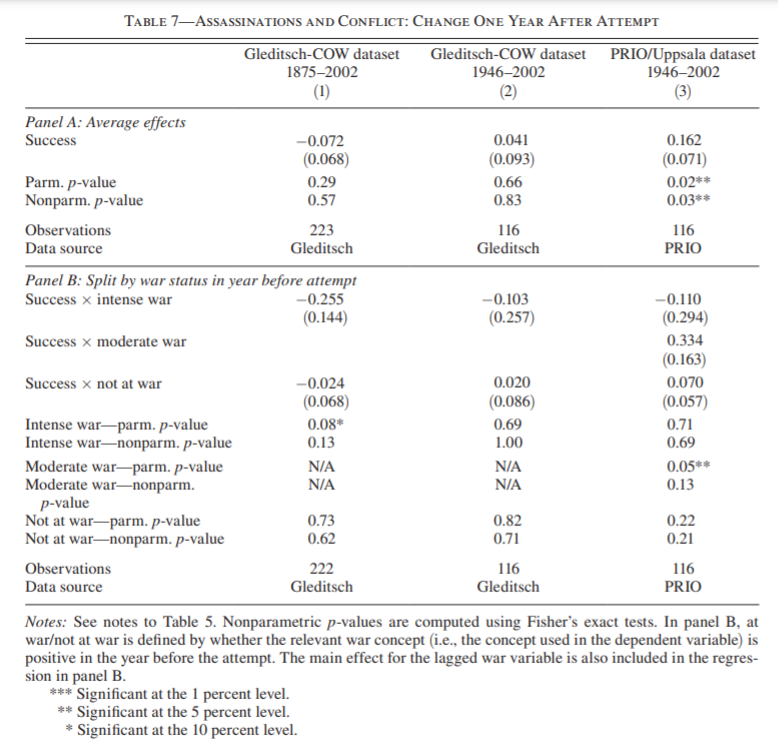 From table 7 we see that possibility of war increases on average after following successful attempt than following failures.
Do Leaders Matter? National Leadership and Growth Since World War II.
- Unfortunately, economic growth data only start in 1950, and for most countries, it only starts in 1960 or 1970.
- There are not enough assassination attempts during that period(especially in autocratic regimes) to really be of much use
- So here we use a different approach: we consider deaths of leaders either in accidents or by natural causes.
Methodology:
- Compare economic growth rates 5 years before the death of the leader with 5 years after
- Ask: in general, are the changes in growth rates over the 5-5 year intervals when leaders die larger than what would be predicted by random chance?
Findings:
- Leaders matter
- But only in autocracies, not democracies
- Random leader changes affect inflation