Supply-demand and break-even-analysis
Essentially, equilibrium is a point in diagram, which lacks tendency to change. Equating functions in same graph (intersecting) would create an equilibrium. That point may represent profit maximizing situation in firm or underemployment level in national income or etc.
Supply and demand analysis
Given Supply \(Q_s = -10 + 6p\)
Demand \(Q_d = 100 – 5p\)
What will be equilibrium price and quantity?
At open economy price will be at equilibrium of supply and demand. Thus to find price we equate \(Q_s\) and \(Q_d\): -10 + 6p = 100 – 5p Solve for p: 11p = 110 $P_e$ = 10 is equilibrium price Let's find equilibrium quantity: Just put Pe to equation: -10 + 6(10) = 100 – 5(10) $Q_e$ = 50
Now, when we have an understanding of equilibrium analysis let's consider break-even-analysis.
Break-Even-Analysis
For any business, it is crucial to make profits. Especially it is important to know how much to sell to make profit. For decision making in such situations, break-even-analysis is used.
To do break-even-analysis, we need to understand what is a break-even point and determine it. Basically BEP is point of neither losing nor winning. In business it is when profit equals zero, i.e. balance sheet stands exactly between loss and profit. There are several ways to determine BEP: a) graphically represent cost and revenue, and find their point of intersection; b) equating cost to revenue; c) equating profit to zero.
For example, we want to sell apples. Plantation costs $30. Collection costs $2 per each apple. Market price per apple is $5. How much to sell to at least make profit?
a) Graphical method:
Construct function of revenue and cost on same graph. Revenue function = Price * Units sold. Cost function = Fixed cost + Variable cost per unit. Thus, R = 5q and C = 30 + 2q Then, it will look like this:
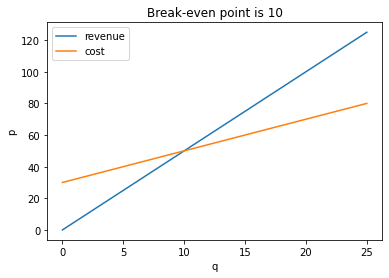
In this graph revenue function intersect with cost function, point of intersection is called break-even point, it equals to 10, which means that selling 10 apples would exactly cover our costs but bring no profit. If we sell less than 10 apples we taking losses, if we sell more than 10 apples we make profit.
b) Equate cost to revenue:
In previous example we actually equated cost to revenue by plotting them in same graph. But it is also possible just solve it algebraically: R = C 5q = 30 + 2q subtract 2q from both sides 3q = 30 divide both sides by 3 q = 10 The same answer as in previous example!
c) Equate profit to zero:
In economics sense, profit is the difference of revenue and cost. Thus, we need to solve this:
5q – (30 + 2q) = 0
3q – 30 = 0
q = 10,
same answer
Another example, suppose cost of release of bicycle is $ 50 000. Variable cost is $ 200. Price is given by function 800 – q. How many bicycles to sell to make profit?
Let's solve by equating revenue to cost. Then, R = C would bring following:
(800 – q) q = 50000 + 200q
(expand brackets)
800q – q^2 = 50000 + 200q
(subtract 200q from both sides)
600q – q^2 = 50000
(equate to zero)
- q^2 + 600q – 50000 = 0
(find roots)
x1 = 100
x2 = 500
Which means that in area of 100 and 500 units, profit would be given. Here is quadratic function, that is why it is solved by equating revenue and cost first and then finding roots. Found roots here represent amount of units.
Taxes example: We sell products and taxes should be paid. Lump-sum tax at amount of $100 and excise tax $5 per each. Fixed costs $100. Variable costs $10 per each product. Price per product is $25. How much to sell to make profit?
Then, lump-sum tax is added to fixed costs while excise tax added to price of product.
We need to solve: 25q = 200 + 15q q = 20, product to sell to cover costs. And 21-st product brings profit.
Thus, in approaching business problems requiring making managing decision, you shall do break-even-analysis graphically or algebraically to make best possible decision. In determining equilibrium price and quantity- do supply and demand analysis.