Shapes of Supply and Demand curve
We have looked at market equilibrium and shifts in quantity and price of goods that are sold under the market shock. We discussed only qualitative part of shifts. We have not disscussed the magnintude in the change of prices and quantities of goods sold.
Shapes of supply and demand curve determine how much a price and quantity changes under the shock.
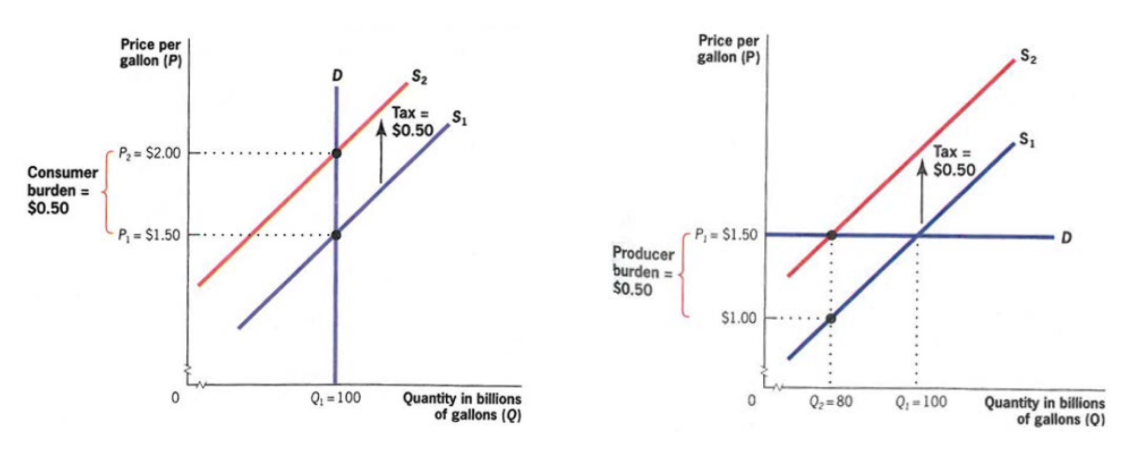
Perfectly inelastic demand means the demand does not change under any circumstances.
There is no goods in real-life that are perfectly inelasic.
Perfectly elastic demand is the demand for the good, when people are ready to pay a given price and no penny more. If the good will be one penny cheaper, buyers will buy infinite amount.
Price elasticity of Demand
The price elasticity of demand (or in common use, the elasticity of demand) is the percentage change in the quantity demanded, Q, in response to a given percentage change in the price, p, at a particular point on the demand curve. The price elasticity of demand (represented by \(\varepsilon\), the Greek letter epsilon) is \(\varepsilon = \frac{\text{percentage change in quantity demanded}}{\text{percentage change in price}} = \frac{\frac{\Delta Q}{Q}}{\frac{\Delta P}{P}}\)
For example, if a 1% increase in the price results in a 3% decrease in the quantity demanded, the elasticity of demand is \(\varepsilon\) = -3%/1% = -3.3 Thus, the elasticity of demand is a pure number (it has no units of measure).
Tutorial
Price elasticity of Supply
Just as we can use the elasticity of demand to summarize information about the shape of a demand curve, we can use the elasticity of supply to summarize information about the supply curve. The price elasticity of supply (or elasticity of supply) is the percentage change in the quantity supplied in response to a given percentage change in the price. The price elasticity of supply (represented by \(\eta\), the Greek letter eta) is
Tutorial
Example
Amazon prime example
Appstore vs Google apps store
Problem
The estimated equation for the linear U.S. corn demand curve is \(Q = 15.6 - 0.5p\), where p is the price in dollars per bushel and Q is the quantity demanded in billion bushels per year. What is the elasticity of demand at the point on the demand curve where the price is \(p = 7.20\) per bushel?
The shape of the demand curve depends on the relevant period. Consequently, ashort-run elasticity may differ substantially from a long-run elasticity.(Oil prices, frozen goods)
Equilibrium effects on specific tax
Tax incidence means who bears the burden of taxation.
Economic burden of the tax typically differs from who gets taxed, because market reacts to the tax.
Statuatory tax incidence \(\neq\) Economic tax incidence.
The price responses in the market are going to work to counteract the statutory burdens of who the tax is imposed on.
Let' defince Consumer Tax Bruden as \((p_{post}-p_{pre})+ \text{tax payment per unit}\).
Producer Tax Burden \((p_{pre}-p_{post})+\text{tax payment per unit}\)
Whether the goverment will tax consumers or producers, it is irrelevant to economic tax incidence.
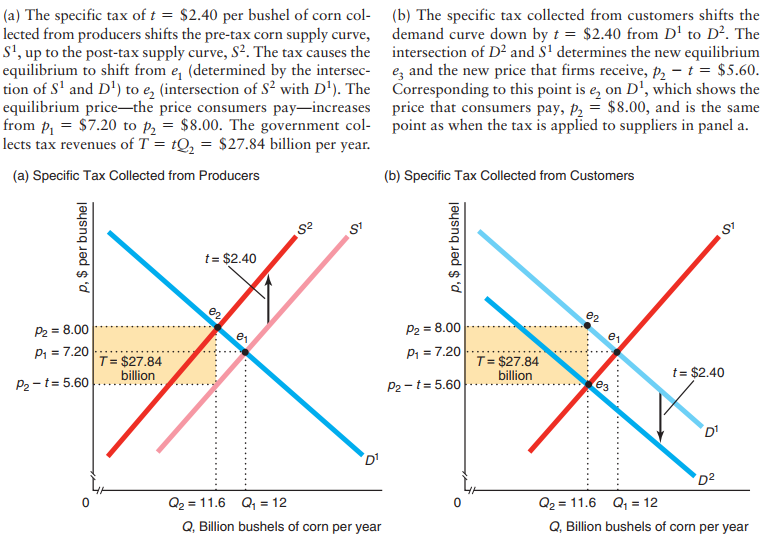
Question: Deputy A suggests taxing 1$ corn producers for every bushel they sell, deputy B suggests taxing 1$ corn consumers for every bushel they buy. Whom we should support?
Economic incidence is determined by elasticities