Materials
| № | Date | Title | Materials at Github | View | Additional Materials |
|---|---|---|---|---|---|
| L1 | 8th semptember | What is Data, Why Python, Data-driven policy making | Slides | ||
| S1 | 8th Semptember | Variables, Strings, Multiline Strings in Python | Seminar 1 | nbviewer | |
| S2 | 10th Semptember | If Statment, List, Dictionary, Set, For Loop Statement in Python | Seminar 2 | nbviewer | |
| S3 | 15th Semptember | Functions, Modules, Matplotlib library, Stock prices plots | Seminar 3 | nbviewer | |
| S4 | 17th Semptember | Introduction to Numpy and Pandas library | Seminar 4 | nbviewer | |
| S5 | 22th Semptember | GroupBy, Pivot and Pivot Table methods | Seminar 5 | nbviewer | |
| S6 | 24th Semptember | Practical assignments in the class(input(), int()) | Seminar 6 | nbviewer | |
| S7 | 29th Semptember | Practical assignments in the class(For Loop, While Loop) | Seminar 7 | nbviewer | |
| S8 | 1st October | Practical assignments in the class(Random module, list, dictionaries) | Seminar 8 | nbviewer | |
| S9 | 13 October | Exercises on Functions. | Seminar 9 | nbviewer | |
| S10 | 15 October | Quiz. Output formatting, writing to text, csv files. | Seminar 10 | nbviewer | |
| L2 | 20 October | Causality and Prediction (Econometrics and Machine Learning). | Lecture 2 | GDrive | Machine Learning and Prediction in Economics and Finance Machine Learning and HR Randomized Controlled Trial |
| L3 | 22 October | Exploratory Data Analysis. Estimates of location (mean, median), estimates of variability (variance, standard deviation). Quiz. Data vizualization (pie chart, bar chart, histogram, density plot, scatter plot). | Lecture 3 | GDrive | Misleading graphs |
| S11 | 27 October | Plotting Scatterplots, lineplots, barcharts with seaborn library. Bar Chart Race package. | Seminar 11 | nbviewer | |
| S12 | 29 October | Plotting histograms, empirical cumulutative distribution function(ecdf). | Seminar 12 | nbviewer | |
| S13 | 3 November | Bivariate distribution, boxplot, jointgrid, pairgrid. | Seminar 13 | nbviewer | |
| Recap | 5 November | Recap of previous lecture | - | - | |
| S14 | 17 November | Pandas read stata, excel and csv files. Concatenating dataframes. Summary statistics, groupby statistics. | Seminar 14 | nbviewer | |
| S15 | 19 November | Quick recap of pandas. Pandas dtypes. Handling missing data. Operating on Null values. Comparing Null values. Example of conversion of dtypes. | Seminar 15 | nbviewer | |
| S16 | 23 November | Mergin Datasets. Hierarchical Indexing | Seminar 16 | nbviewer | |
| Pr1 | 1 December | Bibigul Arzybaeva presentation | Seminar 16 | nbviewer | |
| Pr2 | 3 December | Rysmende - Artificial Intelligence | Presentation | GDrive | |
| S17 | 8 December | Apply function. Iterating over dataframe. JSON format. Google maps API | Presentation | GDrive | |
| S18 | 10 December | Comparison operators. Some terminology. Tuple. Zip. Lambda function. Map, filter, reduce, list comprehension, dictionary comprehension. | Presentation | GDrive |
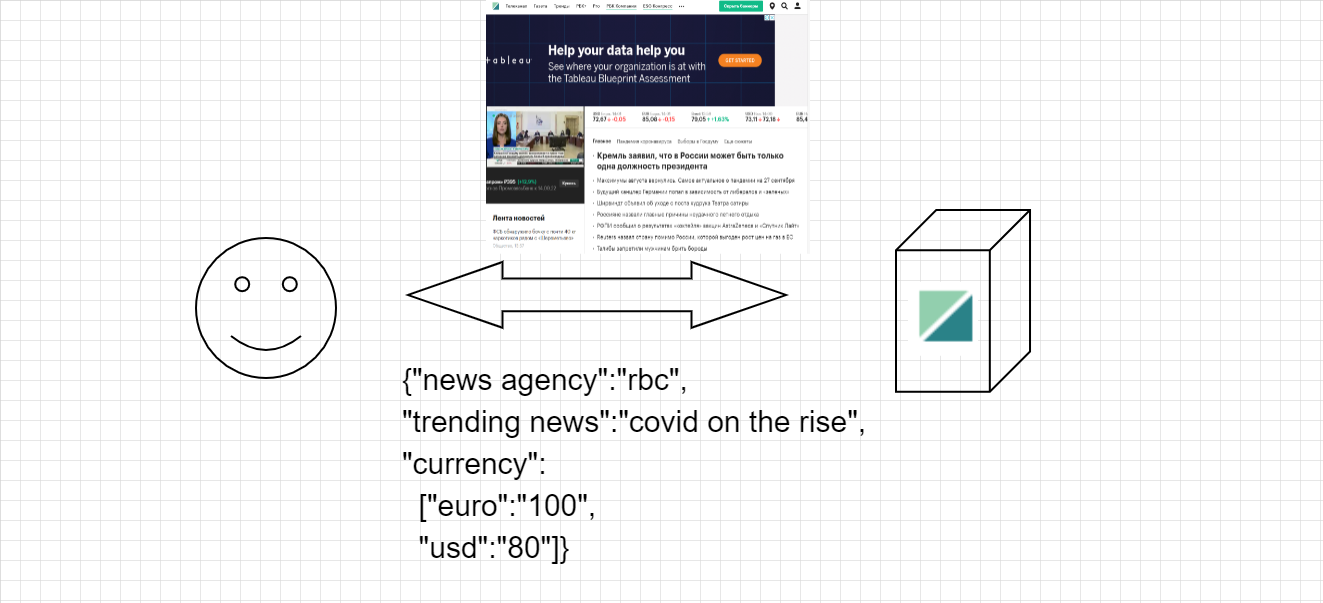
JSON
JSON (JavaScript Object Notation, pronounced /ˈdʒeɪsən/; also /ˈdʒeɪˌsɒn/) is an open standard file format and data interchange format that uses human-readable text to store and transmit data objects consisting of attribute–value pairs and arrays (or other serializable values). It is a common data format with a diverse range of functionality in data interchange including communication of web applications with servers.
For detailed JSON introduction look into w3schools
