Practical issues when running regression
Whenever you run regression, you will always see t-test in regression. Evidently t-test is very important number in regression.
If the errors have a normal distrivution, then so do the \(\beta\). But their vaiances(and covariances) depend on the error variance, which we typically will not know. So when we subsititute in \(\hat{\sigma}^2 for\)\sigma^2, the standardized version of $$\hat{\beta} now has a t distribution, not a normal distribution any more.
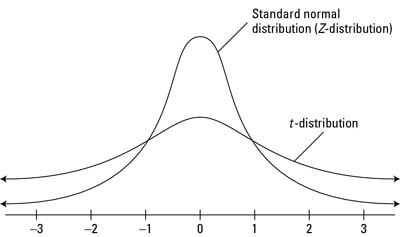
We need t-distribution for a small sample. As the sample becomes large enooug t-distribution becomes normal, so it does not matter if you have large sample.
To justify OLS model we do need to assume that the errors are normally distributed. We just need that errors are Independently Identically Distributed(IID).
In the case when errors are not normally distributed(but IID), we can do t-test, esentially as a way of being a bit more conservative, because t-test does not assume normal distribution of errors. So basically, for t-test tails of the distribution are a little bit fatter, so the critical value will be a little bit more conservative than with a normal distribution.
 Source:link
If we want to test the hypothesis, that a particular coefficient is c, where c might be zero or any other constant that we know. The t-test is simply the,
\(t = \frac{(\hat{\beta_i} - c)}{se(\hat{\beta_i})}\) where $$se(\hat{\beta_i}) = (\sigma^2(X*X)^{-1}))_{ii}^{1/2}
Regressions with Binary Dependent Variables on the RHS
When the dependent variable is a dummy variable the errors are certainly are not normally distributed, because our outcome \(y\) is 1 or 0.
\(Y_i = \aplha + \beta D_i + \epsilon_i\)
Definition: \(D_i\) is a dummy variable, or an indicator variable, if it takes the value 1 if the observation is in group A, and 0 if in group B.
Example:
- RCT: 1 if in treatment group, 0 otherwise
- 1 if male, 0 if female
- 1 before great depression, 0 after
Without any control variables, it is easy to verify that $$\hat{\beta} = \bar{Y_A} − \bar{Y_B} . So you can always estimate the difference between the treatment and control group for an RCT using an OLS regression framework. The standard errors will be slightly different from the Neyman standard errors we computed before (because the Neyman standard errors adjust for sample size of EACH group, whereas the OLS standard errors adjust for the size of the overall sample), but it won't matter that much if the samples are large enough, and similar in treatment and control groups.
| Group A | Group B | Difference |
|---|---|---|
| \(\bar{Y_A}\) | \(\bar{Y_B}\) | \(\bar{Y_A} - \bar{Y_B}\) |
Regressions with Categorical Dependent Variables on the RHS
What if you don't have two groups, but, say, 50 (e.g. 50 states): Your original variable is takes discrete values 1 to 50. • It usually does not make much sense to include it directly as a regressor • Transform it into 50 dummy variables: for each state, the dummy = 1 if the observation is from that state, and 0 otherwise.
By default R will implicetly drop some category as the base category. To drop explicetely particular category you can use relevel function
lm(x ~ y + relevel(b, ref = "3"))